"During the first two weeks of October, weekly container ship capacity transiting the Suez Canal averaged 753k TEU, compared with 1,457k TEU during the same period in 2023. Since the Houthi attacks began in the Red Sea, this is the first time that transits have exceeded 50% of pre-disruption levels."
— Niels Rasmussen, Chief Shipping Analyst, BIMCO
The 753K TEU Milestone: What Recovery Actually Looks Like
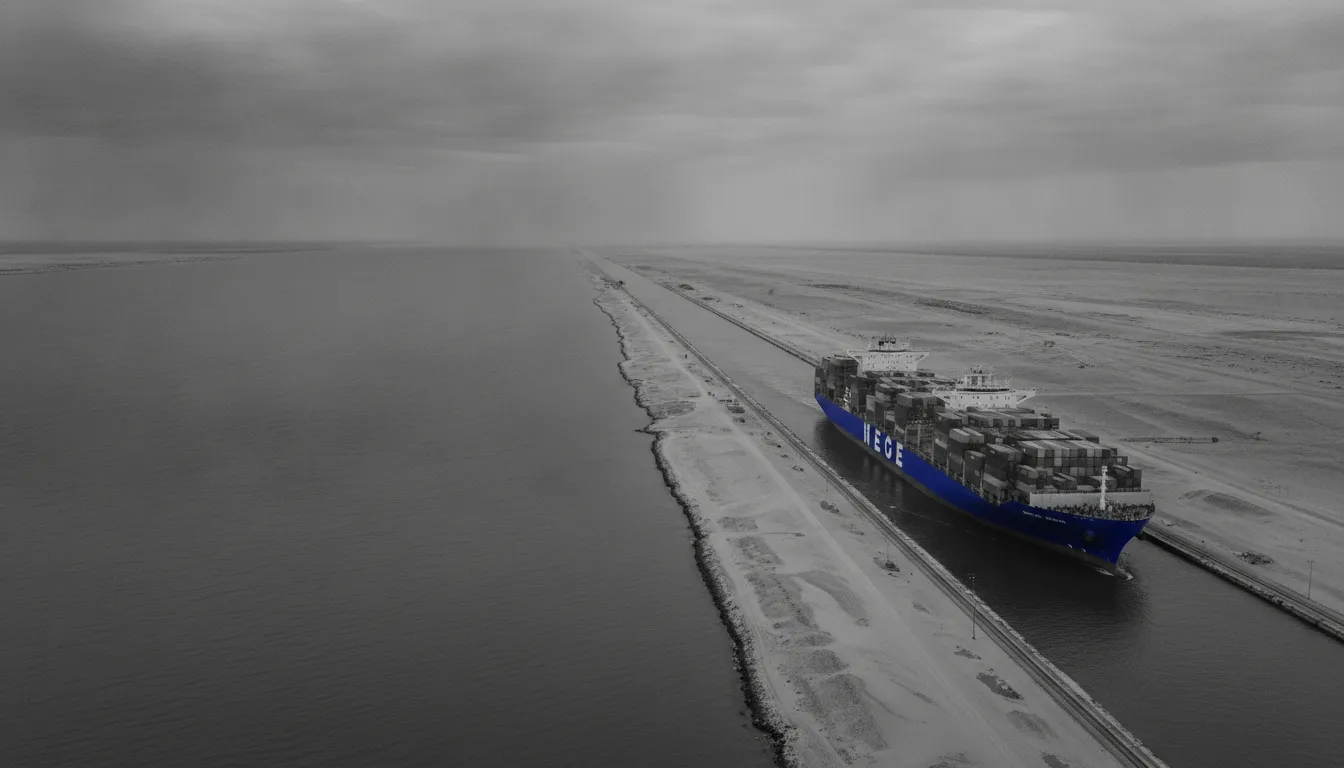
Suez transits have climbed to a level not seen since the Red Sea security crisis fractured global routing in late 2023. The Suez Canal Authority reported that 166 medium and ultra-large container vessels (over 130,000 net tons) transited between July and September 2026, compared with only 16 in the same quarter of 2025. This represents a ten-fold increase in large-vessel activity within a single year. Yet the headline figure masks a deeper structural reality: current volumes represent just 36 per cent of total Asia–Europe container capacity routed via either Suez or Cape of Good Hope, down from the pre-disruption norm of 80 per cent. Despite the acceleration, the Cape route remains entrenched for many services, absorbing roughly 64 per cent of available capacity.
The reasons for incomplete recovery are practical and financial. Northbound transits (Europe-to-Asia) have lagged southbound flows: in Q3 2026, northbound capacity was only 75 per cent of southbound levels, rising to 81 per cent in early October. This directional imbalance reflects carrier caution and asymmetric risk perception. No large shipping line has yet announced a full network reversion to Suez; instead, they are restoring services one lane at a time, with contingency protocols to divert back to the Cape. Maersk, Hapag-Lloyd, MSC, CMA CGM, and COSCO have all returned selected services, but the transition remains incremental and reversible.
Carrier Announcements and the Phased Return Architecture
Between July and September 2026, the major alliances disclosed multiple service restorations to the Red Sea route. Maersk and Hapag-Lloyd's Gemini Cooperation announced four additional services—AE5, AE11, AE12, and ME2—in mid-September, joining AE15 and AE19 which had already resumed Suez transits. Simultaneously, CMA CGM escalated its return by moving ultra-large boxships through the canal on the INDAMEX service (India to US East Coast), which the company calculated would eliminate two vessels from rotation by cutting round-trip transit time by two weeks. MSC restored partial capacity on four services (Jade, Albatros, Tiger, and Himalaya) from late August, whilst COSCO and OOCL began transits on RES4 from July and announced NEU2 resumption on 16 September.
The announcement pattern reveals a strategic logic: carriers are running single services through Suez to test operational and geopolitical stability before committing entire networks. This "service-by-service" model reduces exposure to mid-voyage diversions—which could add 7–14 days to Asia–Europe transits if a security incident forces a return to the Cape. By mid-October 2026, at least 16 confirmed service returns had been announced since July, but no full-fleet normalization has occurred. This measured approach reflects persistent war-risk insurance premiums (estimated at 0.5–1.0 per cent of vessel hull value on Suez transits versus 0.0001 per cent baseline) and ongoing Bab el-Mandeb security volatility.
Dual-Route Demand Compression and Bunker Lead-Time Shock
The simultaneous operation of both Suez and Cape routings has created a novel procurement challenge for port planners and ship suppliers. Carriers maintaining fleets on both routes must hedge inventory risk across geographically dispersed bunkering hubs. As of mid-October 2026, Singapore's VLSFO lead times had extended to 11–18 days from 10–15 days a week earlier, driven by delayed cargo arrivals amid Middle East tensions and low supplier inventories. At South Korean ports (Busan, Ulsan, Onsan, Yeosu, Kwangyang), lead times for major fuel grades ranged from 7–10 days, up from 4–6 days a week prior. In Colombo and Hambantota, some suppliers were quoting 11-day lead times despite average demand levels.
This lead-time compression occurs because the returning Suez services absorb slot availability at Egyptian bunkering points (Port Said, Suez) while simultaneously maintaining Cape-routed contingency capacity at South African ports (Cape Town, Durban) and Mauritius (Port Louis). The supply fragmentation is acute: bunker inventories at Port Suez have reached critically depleted levels across VLSFO, HSFO, and LSMGO grades, whilst suppliers at Cape ports continue to hold elevated stock positions. Bunker brokers report that many firms now extend booking windows to 2–3 weeks simply to secure space confirmation across both routings.
Route Economics and Vessel Rotation Arithmetic
The financial case for Suez return remains contested. A ship routing via Suez Canal saves 10–14 days transit time on Asia–North Europe lanes compared to the Cape, and can reduce round-trip fuel consumption by approximately 30 per cent—translating to $400,000–$800,000 in additional bunker cost per voyage for ultra-large container vessels routing via the Cape. Yet Suez transits now carry a 12 per cent surcharge (reinstated by the Suez Canal Authority in July 2026), plus war-risk insurance premiums that narrow or eliminate the fuel-cost advantage. For vessels above 20,000 TEU, the total-cost calculus often shows rough parity between the two routes once all elements—canal tolls, fuel, charter time, crew costs, and insurance—are weighted.
The capacity-release effect, however, dominates financial calculations. When CMA CGM returned the INDAMEX service to Suez, the two-week transit reduction freed approximately 2 vessels from the rotation. Multiply this across dozens of services and multiple carriers, and the global container fleet effectively releases 6 per cent of capacity back into an oversupplied market. Industry analysts project that full Suez normalization could release 1.5–2.5 million TEU of effective capacity, intensifying downward pressure on freight rates in Q4 2026 and beyond. This dynamic explains why carriers are restoring services one at a time: a simultaneous fleet redeployment would trigger immediate rate collapse.
Regenerating Corridor Congestion: The Port Planner's Dilemma
The phased Suez return creates acute congestion risk at choke points. If a demand surge—such as US tariff front-loading or Chinese New Year pull-forwards—coincides with high Suez capacity utilisation, the partially restored corridor could saturate rapidly. Schedule reliability on east–west lanes currently stands below 60 per cent, and booking lead times of 2–3 weeks are now standard for space confirmation. Any unplanned increase in Suez-routed volumes risks cascading delays at Mediterranean discharge ports (Rotterdam, Hamburg, Antwerp) and Red Sea transit points. The Suez Canal Authority has stated it can accommodate 100 per cent of the global container fleet, but operational throughput remains constrained by convoy-based transit protocols and draft limitations.
For port operators, the challenge is bidirectional: whilst Mediterranean and Northern European terminals face potential congestion from returning Suez capacity, Cape ports (Cape Town, Durban, Port Louis) confront inventory overhang if services diverted away never fully redeploy. Transhipment networks have reorganised around Cape routing over two-plus years; unwinding those arrangements—including MSC transhipment hubs at Walvis Bay (Namibia) and inventory nodes at Port Louis—requires time and creates temporary excess capacity. Spot bunker demand at southern African ports could decline significantly if carriers execute a wholesale Suez return, potentially easing prices in those regions after two years of elevated rates.
What This Means for Procurement and Operations
Buyers and vessel operators must prepare for a three-phase environment through late 2026 and into 2027: first, continued dual-route operations with rising bunker lead times (9–18 days across major hubs); second, asymmetric directional recovery (northbound routes lagging southbound); and third, potential corridor congestion if demand surges occur during high Suez utilisation. Procurement teams should extend bunker booking lead times to 3–4 weeks minimum for spot requirements and secure framework contracts across at least three geographic regions (Singapore or Hong Kong, Port Said or Suez, Cape Town or Durban). Vessel routing decisions should remain flexible—maintain contingency protocols to swap Suez services back to the Cape without penalty, and negotiate rate spreads with awareness that the $200–$400 per TEU freight differential between routes may compress rapidly if freight rates soften in Q4. Finally, monitor the Suez Canal Authority's real-time transit data and carrier announcements weekly; route economics can flip within days if war-risk premiums shift or carrier capacity reroutes unexpectedly.